We answer all your questions about the new web app
New for World Vegan Month, the Veganalyser is a fun new app designed to see how many animals you can save from being born into a life of pain and suffering. Sure it's not 100% accurate - nothing is! - but we hope that you find it as fun and thought provoking as we do.
Thanks to feedback from the initial launch, we've updated the Veganalyser's 'Already vegan?' pathway to reflect the fact that vegans who were previously vegetarians or pescatarians save as many animals as meat eaters who go vegan. This is because the original version did not reflect the fact that vegetarians have already saved X amount of animals by not eating meat.
The 'What difference will you make if you go vegan today?' pathway reflects your current diet: if you are vegetarian, the number of animals you will save by going vegan will not include the animals you are currently saving by being vegetarian. It will only reflect the additional number of animals you save by going vegan.
Jump to:
Summary
While many vegans will attest to an overall feeling of satisfaction in knowing that they are personally doing their part to reduce the cruelty of animals by decreasing the demand for meat and animal products worldwide, most will never know the specific number of animals saved in a given year because of their daily food choices. Given the complexity of animal agriculture, it is not possible to determine this number with precise accuracy: however, a general estimate can be determined. This estimate will be lower than the real number because many numbers of slaughtered animals in certain countries go unreported. This is understandable: due to the nature of animal farming many slip through the net, end up on the black market or are intentionally not recorded, such as with ‘game’. Moreover, the numbers of animal slaughtered due to disease is also not reported within the stats, nor are the numbers of animals killed due to field clearances and other devastating effects of animal agriculture. And don’t forget that vegans tend to avoid leather and other animal products like wool, meaning that even more animals owe their lives to vegan power! Of course, let’s not forget that even if we only helped save one life, that would be entirely worth it.
Adding to the countless tangible benefits of a vegan lifestyle, including improved health and environmental protection, this exercise aims to help you to imagine the benefit your diet brings to the billions of animals that you will never meet, merely by taking a stand on their behalf. Whether veganism is a new choice, a long-term decision or even something you’re considering for the first time, we hope that this exercise will offer you motivation to continue your vegan journey.
How we derived the numbers
Figures for fish and land animals slaughtered were compiled from the Food and Agriculture Organisation's statistics data available at FAOSTAT. To determine the number of animals saved by a vegan, we used two numbers: the total number of animals killed for food consumed in a given year and the size of the 15 and over population during that year in each region of the world. We used the population figures from ages 15 and over because children eat far less than adults on average. These population figures also correspond with the approximate number of vegetarians and vegans in the area, as most veg*n studies have focused on an adult population from the age of 15 and up. We subtracted the number of vegetarians from population statistics involving meat products, and subtracted the number of vegans from population statistics involving dairy and eggs.
Numbers of vegetarians and vegans
To calculate the approximate number of vegetarians and vegans we used the statistics available to us by country, and took an average for the region. We assumed 3.25% of the population were vegetarian and 1.05% were vegan in regions where such statistics didn’t exist based upon a survey of vegan and vegetarians in England, Scotland and Wales carried out by The Vegan Society. If we had stats for only one country in the region we did not take that as the average in case of skewed results. Instead we assumed 3.25% of the population to be vegetarians in the other countries in said region, and found the mean from there. For example, 28% of India’s population is thought to be vegetarian, though no stats are known for the rest of Southern Asia. Therefore 3.25% was the percentage used for the eight other countries and the sum of these percentages, plus India’s, were divided by 9. This then estimated that 6% of the population of Southern Asia was vegetarian. There are limitations to this approach: not all countries will have as many vegetarians and vegans as Britain, while some will have many more due to cultural and religious practices. However, for areas where we’ve assumed the number of vegetarians to be higher than it is, this is not a pressing issue: in each region there will be individuals who eat little to no meat due to preference or circumstance. In this way we tried to make the overall stats work well at an individual level. As we cannot work out exactly who is not eating meat, or eating little meat, it can be assumed that there is a larger contingent than just the number of vegetarians in an area.
Fish
As the Food and Agriculture Organisation presents aquaculture capture data in tons, the number of individual fish captured was derived from dividing the average weight of each species by the equivalent measure in tons. The specific fish used for this category were grouped with similar species which include cods, hakes, and haddocks; herrings, sardines, and anchovies; salmons, trouts and smelts; shrimps and prawns; and tunas, bonitos, and billfishes as these species are commonly captured for consumption. We then multiplied the number of shrimp being caught by 6, as we know that six times the number of shrimp that make it to our dinner table are thrown back dead. We also know that a third of all fish caught are similarly ‘discarded’ in fishing operations. Therefore the numbers of other fish were multiplied by 0.5 to reflect a more accurate amount that are being killed for the dinner table, even if they never end up there. The results were added up for each region. However, there are limitations to this. We are using an average weight based upon fish commonly caught for supermarket consumption, and not taking into account all weights of all fish caught. There are up to 2.7 trillion fish captured a year for various purposes such as for food and fish oil, and this app cannot account for all of them. Moreover we do not include all species of shellfish, which are caught and consumed in incredibly high numbers. However, it does give an indication of roughly how many fish you can save. Unfortunately, the number is likely to be higher.
Consumption
The last thing we did was look at how these statistics pertain to individual consumption. Consumption of animal products is taken into account where vegetarian or pescatarian is selected.
For example: as a meat eater my consumption included meat, fish, dairy and eggs. Now that I am a pescatarian, my consumption includes dairy, eggs and fish. The number of fish I eat will not be the same as the number of fish I ate as carnivore, as I will eat more fish to replace the land animals I was eating. Therefore my consumption of fish goes up.
Using statistics from the Department for Environment, Food and Rural Affairs we have calculated the percentage of meat, dairy and eggs and fish the average person consumes. Using this calculus it is determined that:
As a meat eater, meat, fish, dairy and eggs consumption average rate is
- 78.93% meat
- 11.90% fish
- 9.17% dairy
Once meat is given up the average consumption is
- 56.47% fish
- 43.53% dairy and eggs
The new consumption rate is calculated as:
- 56.47% of 78.93% is new fish intake which equals 44.57% new fish consumption
- 43.53% of 78.93% is new dairy and egg consumption which equals 34.46% added consumption
Therefore someone eating 23.92 fish per year as meat eater now eats 34.58 fish per year as a pescatarian.
Someone eating 0.76 laying hens as a meat eater now eats 1.03 laying hens as a pescatarian.
This has limitations as this statistic will not be true for everyone. It is unlikely that when giving up one food source, another is raised equally. It is more likely that consumption will move across into other food sources such as vegetables, grains and fruits. However, consumption of fish is likely to increase once meat from land animals is given up. Therefore this formula does represent this. A more accurate formula would use data driven by the user, e.g. how much fish did you consume in a week. However this would change how the Veganalyser works as it would be driven by individual consumption rather than the number of animals slaughtered. Via consumption rate we try to account for individual experience, something which the overall stats alone cannot do.
General FAQs
Surely I've saved more cattle?
What many people don't realise is that cattle are very large animals. According to these consumption statistics by the Guardian, British residents on average save 8 in their lifetime. Our stats for Northern Europe, where Britain is situated, calculate that between 6-8 cattle are saved in a lifetime, and 4-6 dairy animals, mainly cows. But don't forget you're saving these animals not just from death but from a lifetime of pain. Those dairy cows are forced to live in gruelling conditions for years producing vast quantities of milk, while other cattle are fattened up. Surely even saving one of these animals is worth it?
How do I know which region I am in?
If you are using the Veganalyser on a desktop, you’ll be able to hover over where you live on the map and that will select the region for you. There is also guidance for mobile and tablet users. By following the link you can see a breakdown of countries by the UN’s classification of regions. For example, United Kingdom is under Northern Europe.
Why has a goat appeared? I don’t eat goat!
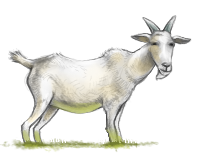 A goat icon reflects ‘other’ animals. This is because goats are the most commonly eaten animals in the ‘other’ category across the world; however, those living in Western regions are more likely to eat rabbit. Other animals included in the category are camels, donkeys, horses, mules and rodents, though not every region will eat every one. Head to FAOSTAT to learn more about which other animals your region eats.
And what about geese? I’m not from Northern Europe and it’s not Christmas!
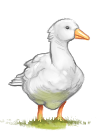
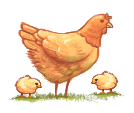 A goose icon (left) represents the ‘birds’ category. This is because a hen icon (right) is already used for the ‘laying hens' category.
Birds includes all poultry, such as chickens, geese, guinea fowl, ducks and turkeys.
And the others?
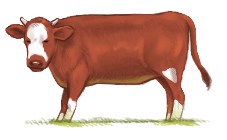 The brown bull icon represents all cattle. This includes buffalo.
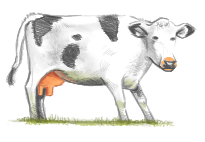 The Friesian cow icon represents all dairy animals. These include lactating sheep, goats, cows, buffalo and camels.
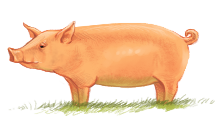 The pig icon represents pigs.
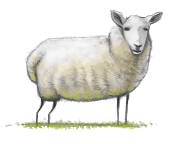 The sheep icon represents sheep.
![]() The fish icon represents fish.
The fish icon represents fish.
Why do I have to be 15 to use the Veganalyser?
You don’t have to be 15, however the age range only begins at 15 due to the reasons mentioned in ‘How we derived the numbers’. If you’re not yet 15, we’re sorry: please try it anyway from the age of 15 and see what you think!
I’m an ovo-vegetarian, not ovo-lacto vegetarian, why am I not included?
Unfortunately we had limited time and space to develop lots of different options, and we believe that the three used are the most succinct. However if you would like us to include more options, please email web[at]vegansociety[dot]com with your requests.
I’m a meat eater but don’t eat pork, why are pigs appearing?
Due to the way we accounted for consumption, you unfortunately cannot pick which animals you do and do not eat. However, by not eating pork, you have already been saving the lives of pigs by not contributing to the demand, and will continue to do so as a vegan.
I eat way more meat than the average person, does this account for me?
We cannot account for individual portion sizes unfortunately as our data covers worldwide statistics. The Veganalyser should be used as rough guide only.
What about imports and exports of beef, fish, etc.?
While the web app accounts for live imports and exports, if animals are slaughtered and then shipped elsewhere we unfortunately cannot tell. This is why the Veganalyser’s data is an estimate, designed to get people thinking about what they eat and their impact.
Technical FAQS
Help! It’s not working!
First of all, clear your cache. When you reload, the Veganalyser should now start working. If not, try a different browser. Report any bugs by emailing web[at]vegansociety[dot]com.
I’m clicking the share buttons, why is nothing happening?
If you have any plugins or add-ons installed on your browser that block tracking then they will often block social media sharing buttons and functionality as well. Extensions such as Ghostery and AdBlock, as well as Tracking Protection are known to block social media sharing. You will need to give permission (through the extension or browser settings) for the app to share to a social media platform. Alternatively, you can download your results image and share that to the social media network of your choice.
I’m on mobile and I can’t share using the Twitter or Tumblr apps?
This is a known issue on Google Chrome if you have the Twitter or Tumblr apps installed on your mobile device. This is will be fixed in an update, until then you can share on Twitter or Tumblr via another browser, on desktop devices or download your results image and share that to either social network.
If you have any further queries or the Veganalyser continues not to work for you, please email web[at]vegansociety[dot]com.